Introduction
Overview
CRISPR-Cas9 (Clustered Regularly Interspaced Short Palindromic Repeats) is one of the most popular gene-editing techniques to modify gene loci at the desired position in a model organism. The gene-editing CRISPR/cas9 method cuts at specific locations of a DNA with the help of a small stretch of guide RNAs that takes the Cas9 endonuclease to a specific site. Increasingly the scientific groups are applying this technology to create genetic screens in order to identify mutations that drive treatment resistance to cancer or rapidly access the drug targets. The aim of the genome-wide CRISPR screening experiment is to screen mutant cells to identify genes involved in a particular phenotype. The beauty of the pooled screen is to integrate many genetic perturbations in one experiment. The CRISPR/cas9 system begins by generating a library of perturbed cells using the library of gRNAs. Lentivirus or Retrovirus is used to deliver gRNAs i.e. integrated to the genome of the cell and serve as a molecular tag. After that cells are separated according to the phenotype of interest and the genes causing the phenotype change can be read out by first isolating the genomic DNA from the population of the cell using PCR followed by sequencing(NGS) across gRNA encoding regions. Then computationally sequencing read count is mapped to a precompiled list of the designed gRNA library.
How does CRISPR screening help scientists find gene targets?
CRISPR-Cas9 (Clustered Regularly Interspaced Short Palindromic Repeats) is one of the most popular gene-editing techniques to modify gene loci at the desired position in a model organism. CRISPR technique is extremely helpful in the identification of genes involved in a particular biological phenomenon. The two main components of CRISPR screening are Cas9 (CRISPR-associated protein 9) and specific guide RNAs that either disrupt host gene or insert gene fragments of interest. Bacteria use this system as a part of their adaptive immune response. Cas9 is an enzyme involved in this mechanism and sgRNA is the complementary sequence of foreign DNA. The popularity of CRISPR-Cas9 is also influenced by its simplicity and cost-effectiveness.
CRISPR Screening provides an interactive way to explore and visualize the quality and analysis results of CRISPR screens. Presently, the tool analyzes the data using MAGeCK-VISPR algorithm and display the results in an interactive and intuitive manner.
Scope of the app
- Swiftly upload large data sets and analyze multiple comparisons in one go.
- Track the processing status of each comparison.
- Visualize and interpret the quality check and analysis results effectively.
- Compare the results of different analyses on the same dashboard.
- Save and share analyses with other collaborators.
- Revisit previously performed analyses at any time.
Getting Started
User Input
CRISPR Screening requires the following two files as input:
Fastq files
Fastq files stores short read data from high throughput sequencing experiments. The sequence and quality scores are usually put into a single line each. These are files in fast.gz format.
A FASTQ record has the following format:
-
A line starting with @, containing the sequence ID.
-
One or more lines that contain the sequence.
-
A new line starting with the character +, and being either empty or repeating the sequence ID.
-
One or more lines that contain the quality scores.
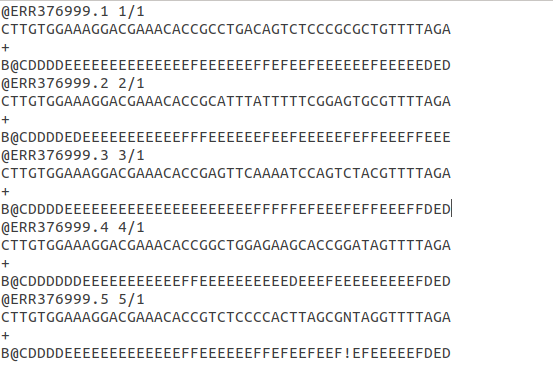
The ideal CRISPR sequence length is only ~20 bp nucleotides. If you find your data contains more than ~ 20 nucleotides, there is a high chance there are adapters in the sequence. These experimental adapters need to be trimmed.
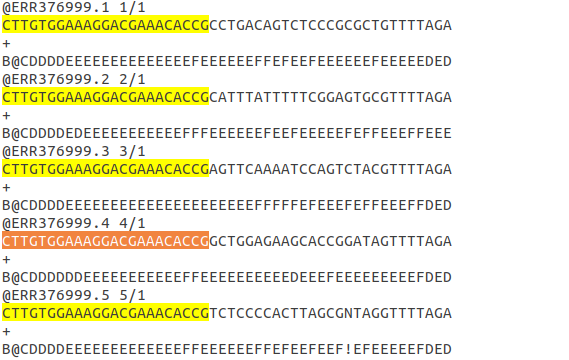
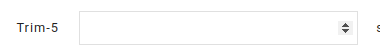
The highlighted sequence is of adapters. You can specify the length of nucleotides to be trimmed in the Trim-5 given under the pipeline and parameter tab.
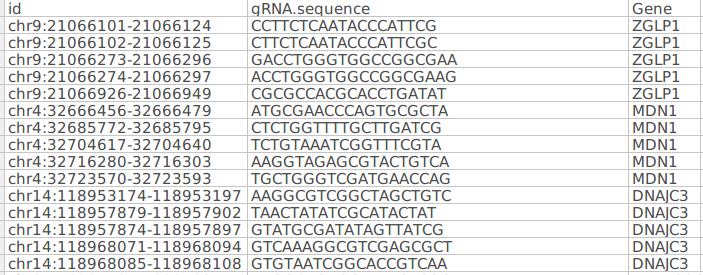
Library file
The library file of CRISPR method stores which sgRNA targets which gene. The file format should be CSV. Each gene associated with multiple sgRNA.
The file contains three columns:
-
Id: contains Unique sgRNA id
-
gRNA sequence: Consists of gRNA sequence. The sequences are searched in the fastq files by the CRISPR screening algorithm to calculate the read counts.
-
Gene: Gene column consists of gene symbol associated with each gRNA sequence
Note: The sequence of these columns should be as given in the figure above. It should be maintained as it is before uploading on the Polly CRISPR application.
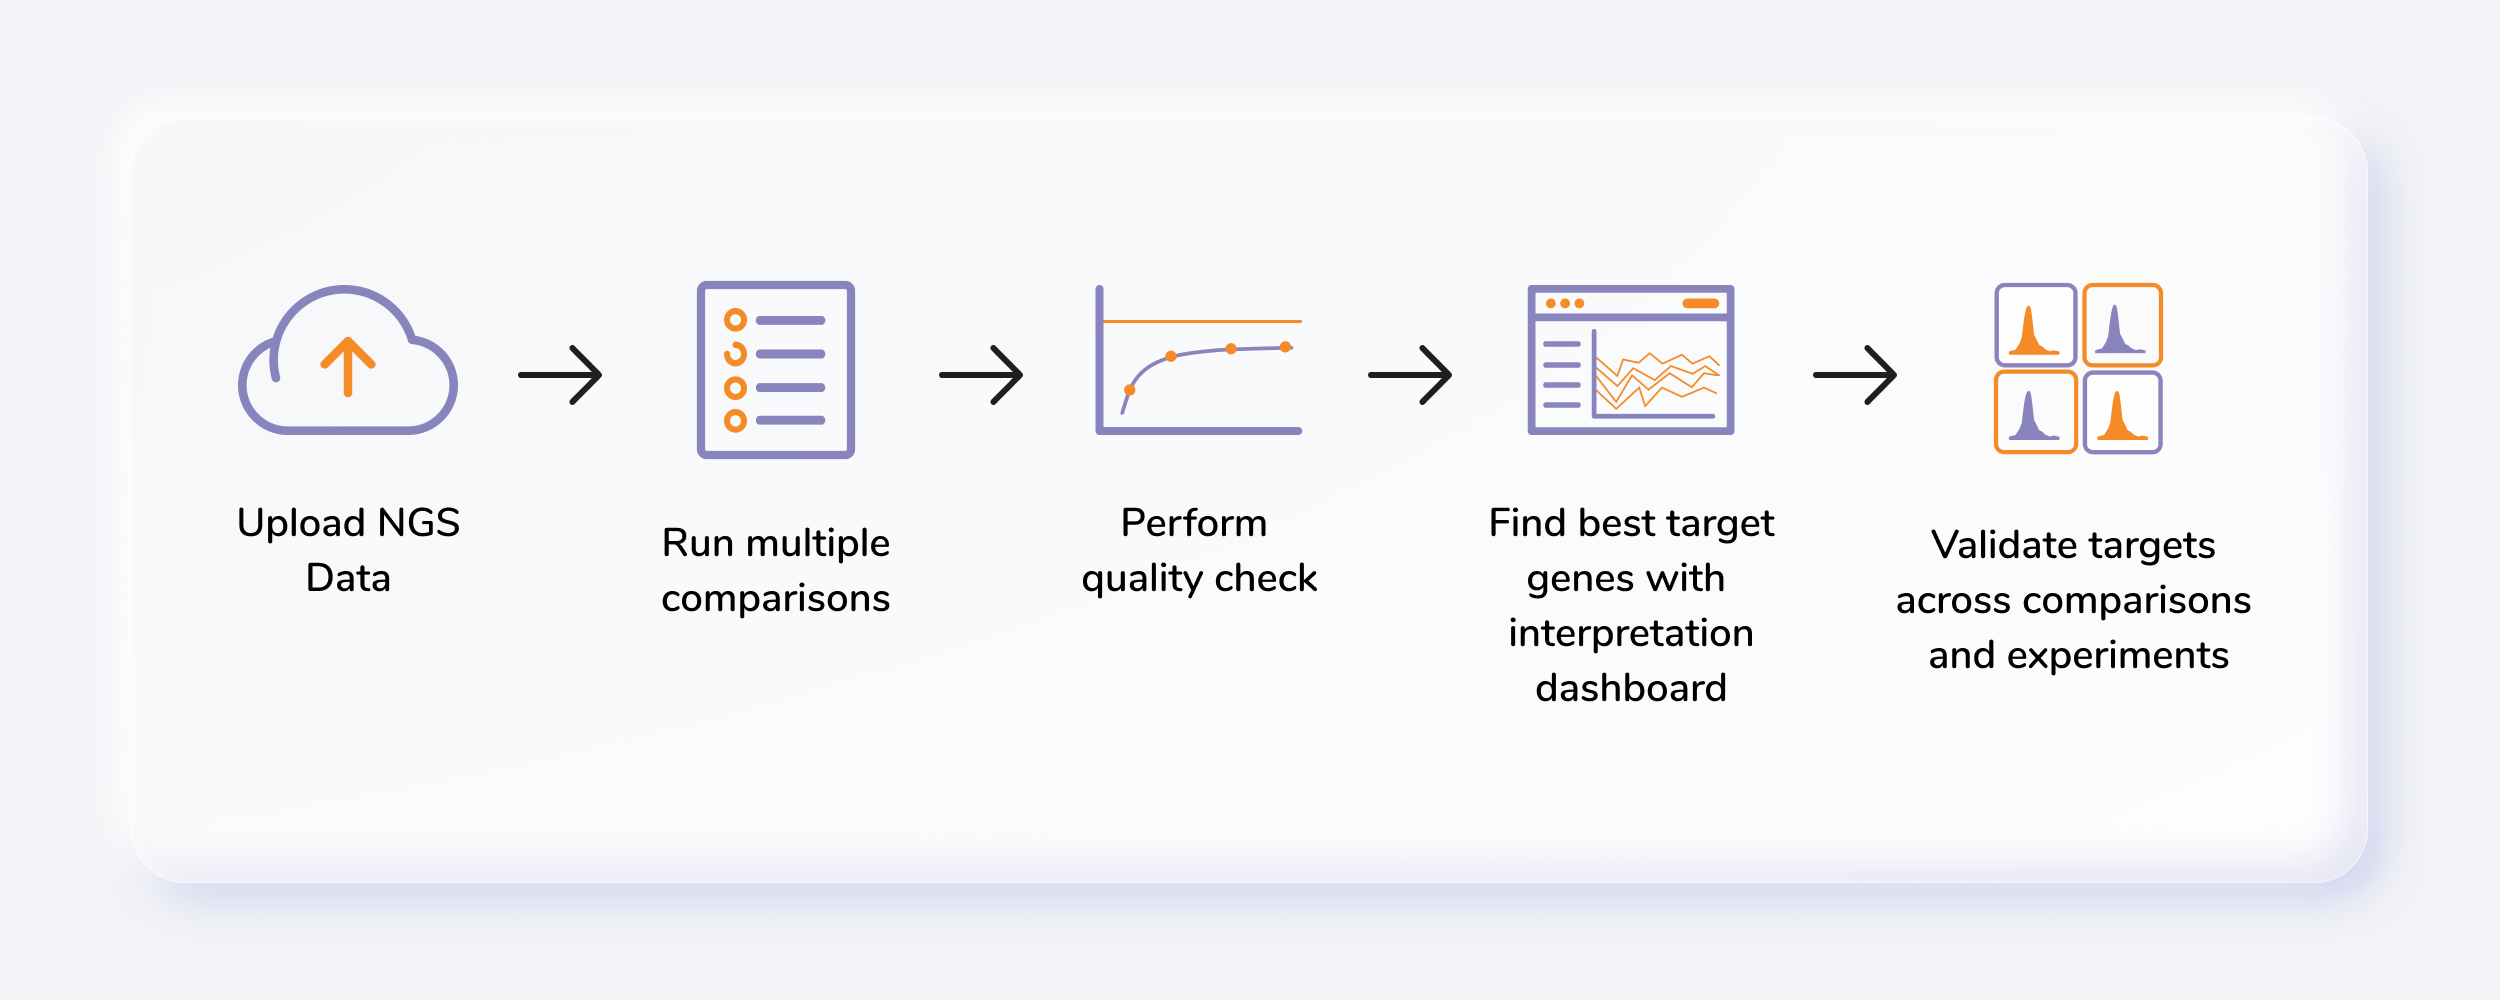
Steps involved in data processing
- Plan a run: To obtain insights from your data generated from a CRISPR screening experiment, open the CRISPR Screening app on Polly.
- Create/Choose a workspace: Before running your data in CRISPR Screening, you need to either create or choose an existing workspace on Polly.
- Uploading data: Polly CRISPR Screening requires two types of input files; fastq.gz files generated from the experiment and the sgRNA library.
- Select pipeline and parameters: You need to select parameters such as Pipeline, Species, Assembly, Trim, and sgRNA length.
- Rename samples: You can rename the samples if required.
- Add comparisons: After filling all parameters you need to create comparisons and define baseline samples as well as various conditions.
- Start processing: Once the comparisons are set you can start processing.
- Log files: You can also look into the progress of run by analyzing log files.
- Go to the dashboard: Once the run has completed you can click on go to the dashboard and analyze data.
- Set base comparison: Select the base comparison to see the table of genes with the p-value and beta score.
- Quality control: You can check the quality of analysis at the sequence level as well as the sample level. In sequence level quality check, you can find graphs of sequencing reads, GC content, Base quality, Mapped reads, Gini index, and zero counts. Similarly at the sample level there are PCA clustering, Read count CDF and normalization graphs.
- MAGeCK VISPR: MAGeCK VISPR output consists of sgRNA Read count plot and any gene of interest can be selected in various samples. Similarly, Hierarchical clustering over normalized beta scores (using Ward variance minimization and Euclidean distance) on 500 genes is also provided. You can also analyze the various comparisons and distribution plots.
- Cross-analysis comparison: In Cross-analysis comparison feature you can select any relevant comparison from previous analysis and compare with the results present analysis.
Tutorial
CRISPR Screening provides an interactive way to explore and visualize the quality and analysis results of CRISPR screens. Presently, the tool analyzes the data using MAGeCK-VISPR algorithm and display the results in an interactive and intuitive manner.
NOTE:
- The public dataset used for the tutorial is extracted from the paper "A CRISPR Dropout Screen Identifies Genetic Vulnerabilities and Therapeutic Targets in Acute Myeloid Leukemia(Tzelepis et al)". Genome-wide drop-out screens were performed in 5 Acute Myeloid Leukemia (AML) cell lines and 2 Non-AML cell lines (HT-29 and HT-1080). For our study, we have considered three AML cell lines i.e. OCIAML3, MV411, and MOLM.
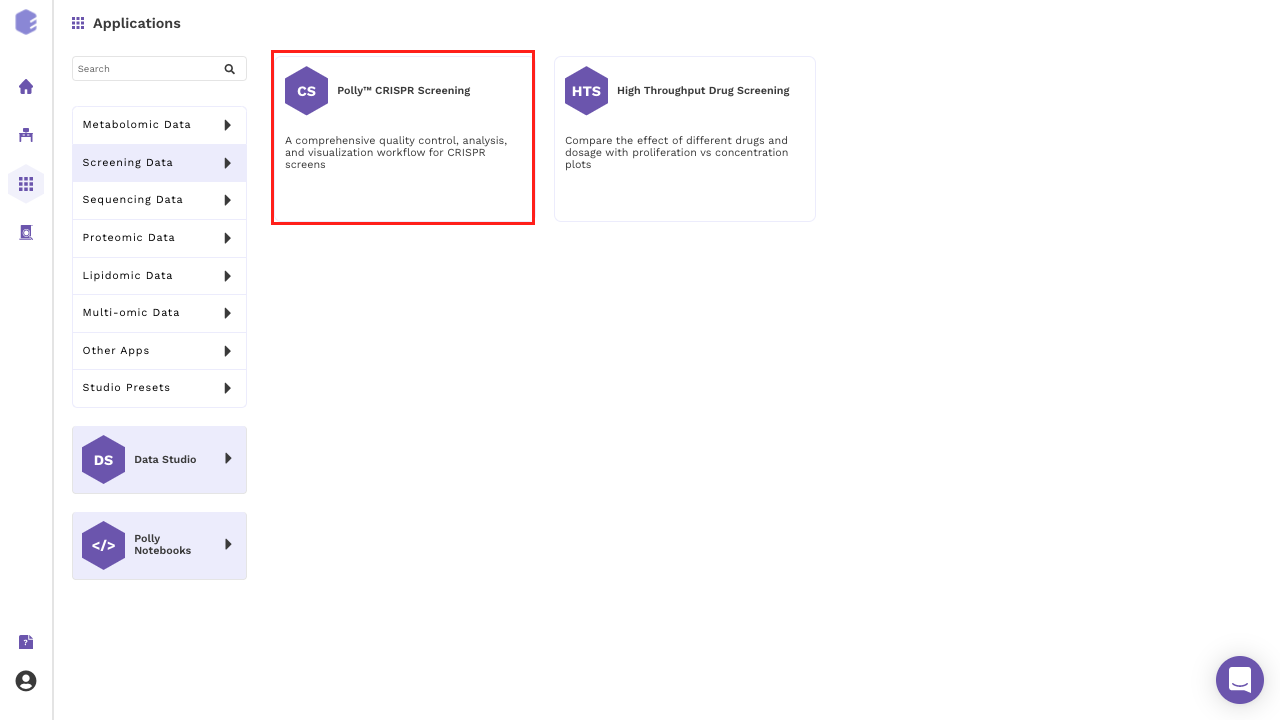
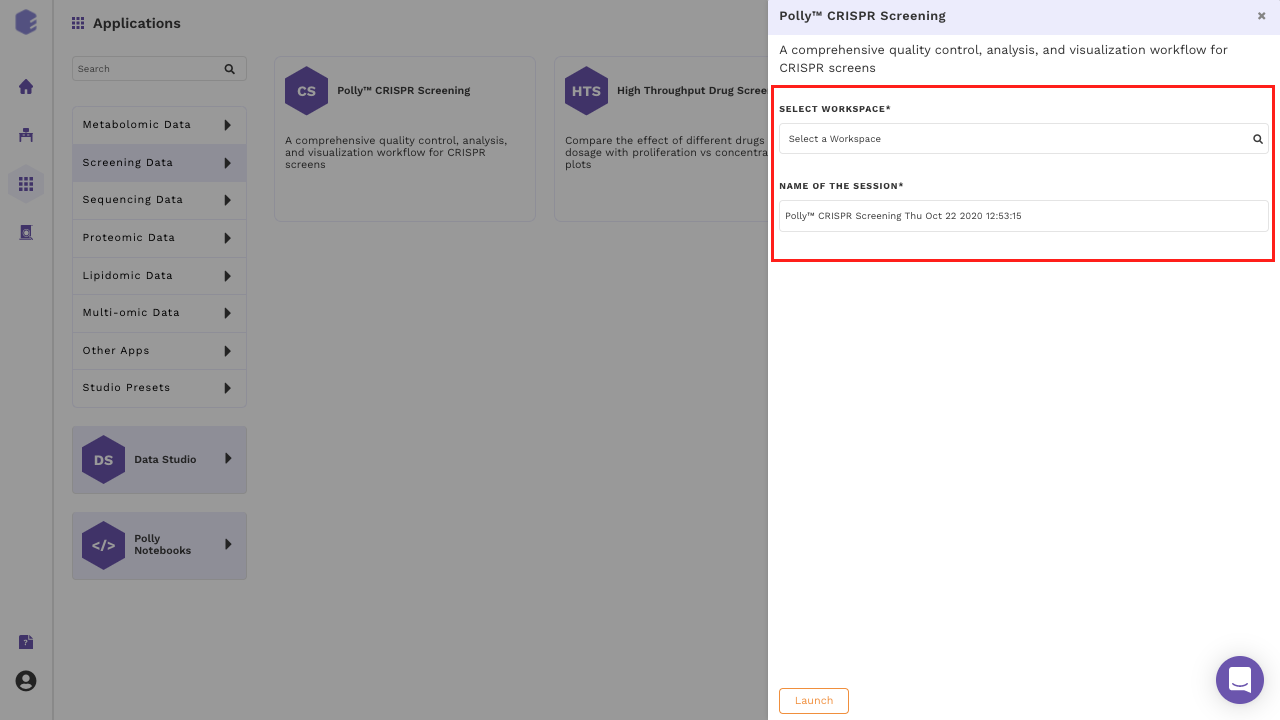
Select CRISPR Screening from the dashboard under the Screening and Sequencing Data Tab as shown in Figure 6. Create a New Workspace or select from the existing one from the drop-down and provide a Name of the Session to be redirected to CRISPR Screening's upload page.
Upload Files
Upload the files in their respective tabs as indicated by the screenshots below.
- Click on Upload Files on the Upload Fastq Files box to upload the fastq.gz files.
- Click on Upload Files button on the Upload sgRNA Files box to upload the library file in .csv format.
upload.png)
- Track the status of the upload real-time.
progress.png)
Set parameters and process comparisons
Upon successful upload of the files, the next step is to set parameters. All the parameters indicated in the screenshot below are required for processing the data.
Note:
- Parameters for Demo Dataset are:
- Species: Homo sapiens
- Assembly: hg38
- Trim-5': 23
- sgRNA length: 19
parameter.png)
Give identifier names to the uploaded .fastq samples
editor.png)
Renaming of comparisons and selection of conditions and baseline
Rename the default comparison and select baseline and condition samples for this comparison as indicated in the screenshot. After selecting the baseline & condition samples, select Start Processing option.
default.png)
Add another comparison by clicking on the button Add New button at the right corner of the screen.
Note:
- Once you click on start processing, editing of all the existing comparison is disabled.
- You can add multiple comparisons in one go without waiting for the analysis completion of the previous comparisons using the Add New option.
Restore analysis
After the coffee break, you can go to the working project by following small steps:
-
Login to Polly
-
Go to Manage Tab.
-
Click on the workspace you were working on.
Track the progress of each comparison with the help of the icons depicted below.
comp.png)
Dashboard
After clicking on Go To Dashboard, the following screenshot is displayed.
dashboared.png)
Analysis Table & sgRNA Plot
The table displays the beta score, p-value and FDR values for each gene.
- sgRNA Plot: The sgRNA plot navigates you to visualise the normalised counts of each gene. By clicking the gene name in the table the sgRNA plots changes accordingly. You can download the plots, normalised counts and result table of the analysis by clicking on Download button on the top right corner of the page. By default, all sgRNA and Samples are selected and displayed in the sgRNA Read Count Plot. sgRNA Plot Setting: Under setting, there is an option of select and deselect of sgRNAs or samples of interest.
sgrna.png)
-
Distribution Plot:
- CDF Plot: The cumulative distribution function of p-values. Smallest FDR greater or equal to 5% and 25% are displayed.
cdf.png)
Figure 17. CDF Plot - Count Plot: Histogram of p-values. Small p-values should be enriched. If a one-sided test is performed, p-values toward 1.0 are expected to be enriched as well.
histo.png)
Figure 18. Count Plot
Note:
- To download the distribution plots, the CDF Plot is selected or Count plot is opened first and then select Distribution in the drop-down menu of Download. The respective image will be downloaded.
The table representing beta score, FDR and p-values for the genes is sorted based on the beta score by default. You can change the setting in either ascending or descending direction by clicking on the headers of each column. There is a functionality to filter the genes by adjusting the range in each column. Also, you can search for gene of interest just by typing on the search white box. Additionally, you can click on any of the genes in the table to view a detailed information about that gene in a new tab.
-
Beta score: Beta score is a measurement of gene selection. It is equivalent to log fold change in differential expression analysis. It reflects the extent of selection in each condition.
- Beta score of a gene > 0, it reflects gene is positively selected.
- Beta score of a gene < 0, it reflects gene is negatively selected.
-
p-value: p-value helps to determine the significance of the result.
- A small p-value (typically ≤ 0.05) indicates strong evidence against the null hypothesis, so you reject the null hypothesis.
- A large p-value (> 0.05) indicates weak evidence against the null hypothesis, so you fail to reject the null hypothesis.
- p-values very close to the cutoff (0.05) are considered to be marginal (could go either way). Always report the p-value so your readers can draw their own conclusions.
-
FDR: FDR determines the adjusted p-value for each test. It controls the number of false discoveries in those results that result in discovery (i.e. significant p-value). A p-value of 0.05 implies that 5% of all tests will result in false positives. An FDR adjusted p-value (or q-value) of 0.05 implies that 5% of significant tests will result in false positives. The latter will result in fewer false positives.
Switch Selection
By default, the table get displayed is of Negative Selection. The selection can be changed by clicking on the toggle button.
Switch Comparison
By clicking on the tab Switch Comparison, you can change the comparison that has been processed in the current analysis.
Access QC plots and analysis visualizations using the module section
Click on button present at the left of the screen. Following options will pop up:
analyze.png)
Have a look at the QC module
You can have a look at the QC module by clicking on the button as indicated on the screenshot below. Sequence Level QC measurements aim to detect problems with the sequencing, similar as in another next-generation sequencing (NGS) experiments. Glance through the sequence level QC summary from here.
| QC TERM | DESCRIPTION | EXPECTED | SCREENSHOT |
|---|---|---|---|
| GC Content Distribution | Measures GC content across the whole length of each sequencing reads | Similar distribution for all samples from the same library | 1GCcontent.png) |
| Base Quality | Measures the base quality distribution of sequencing reads. | Sequencing Reads should have reasonable median value > 25. | 2BaseQuality.png) |
| Sequencing Reads | Gives the total number of sequencing reads. | May vary depending on the sequencing platform. | 3SequencingReads.png) |
| Mapped Reads | Total Number of mapped reads to the sgRNA library. | Good Statistical power of downstream analysis relies on sufficient reads preferred to be over 300. | 4MappedReads.png) |
| Gini Index | Measures the evenness of the sgRNA read counts. It is the log scaled read count distribution. | Gini Index: 1. Plasmid or Control Samples ~ 0.1 2. Negative Selection Samples ~ 0.2 High Gini index in plasmid library, in early time points, or in negative selection experiments may indicate CRISPR oligo-nucleotide synthesis unevenness, low viral transfection efficiency, and over the selection, respectively. | 5GiniIndex.png) |
| Zero Counts | Number of sgRNAs with zero counts. | ~ 1% of total sgRNAs. | 6ZeroCounts.png) |
Visualize sample level QC
By selecting the indicated categories. Checks the consistency between samples.
| QC TERM | DESCRIPTION | SCREENSHOT |
|---|---|---|
| PCA Clustering | Calculates pairwise Pearson correlations of sample log read counts and draw the samples on the first three components of a Principle Component Analysis (PCA). Samples with similar conditions should cluster together | 1PCA.png) |
| Read count CDF | 2Readcount.png) |
|
| Normalization | Boxplot shows the normalized read count distribution. | 3Norm.png) |
Explore MAGeCK-VISPR results
By clicking on the indicated module and selecting the visualization of interest.
| CATEGORIES | DESCRIPTION | SCREENSHOT |
|---|---|---|
| Clustering | k- means clustering view over normalized beta scores of all conditions (using Ward variance minimization and Euclidean distance) on top 500 genes. | 1Clustering.png) |
| Comparisons | Generates the Venn diagram displaying the overlap of significant genes in different comparisons. When you hover on the intersected area, you get the list of common genes in the analysis. | 2Comparision.png) |
Multi Comparison
In Multi Comparison, you can compare the current analysis with the previously processed analyses irrespective of whether they are in the current workspace or a different workspace. To view multiple comparisons follow these steps :
-
Click on Multi-Comparison. A drop down with a list of all the CRISPR Screening analyses pops up.
-
Select the comparisons you want to compare with your base comparison. Base Comparison is the comparison selected in the current analysis.
Multi.png)
- Once the comparisons are selected, click on the Save button on the top right corner of the page. On doing so, the following table is displayed with all the selected comparisons.
Tab.png)
-
By default, the table displays values for the negative selection. It can be switched to positive selection by clicking the positive selection option (as shown earlier for a single comparison).
-
The multi-comparison table can show union or intersection of the genes present in all the comparisons. Here, union will show all the genes present in all the comparisons and intersection will only show genes which are common to all the comparisons. by default, union is selected. This can be changed by selecting the intersection option on the top of the screen.
.png)
-
sgRNA read count plot for multiple comparisons can be seen together one below the other (two at a time).
- Go to the MAGeCK VISPR option.
- Click on sgRNA Read Count Plot.
- Options and Info box opens from the right side of the screen. Select the gene for which the plot is required and click on Apply Changes. Once done, plots for two comparisons appear one below the other as shown in the image.
sgc.png)
Figure 22. Compare sgRNA Read count plot of a gene of interest in the base and comparisons performed in the previous analysis - The comparisons for which the plots are shown can be changed by clicking on the translucent arrows next to the images.
grp.png)
sgRNA Removal
There are multiple sgRNAs associated with a gene in experiments. If the count of any sgRNA is abruptly high in a sample, it can be removed as an outlier using the sgRNA Removal feature.
This feature removes the sgRNAs which have counts greater than to the product of the median multiplier & median count of all the sgRNAs in a sample treating them as outliers. The outlier sgRNAs can be removed by providing any natural number as the median multiplier in the sgRNA Removal box. It will give the estimated number of gRNAs left in the matrix. You can iterate based on the total number of gRNAs left in the count matrix to perform the MaGeCK analysis.
Follow these steps to remove these abruptly high sgRNAs
-
Select the srRNA Removal option from the pop up box on the left hand side
.png)
-
It will take some time for the sgRNA file to be fetched. Then, a box will open to enter the Median Multiplier.
.png)
-
Enter the desired median multiplier in the box and click Run. The number of sgRNAs rejected and remaining will be shown. You can keep changing the multiplier till a satisfied number of sgRNAs are remaining.
.png)
-
Once you are satisfied with the number of sgRNAs, click Run MLE. This will start running a comparison with just the remaining sgRNAs. Once the new comparison starts, a notification appears on the top right of the screen. Once the comparison is processed, it will be available in the list of comparisons in this analysis.
.png)
Videos
References
- Li W, Köster J, Xu H, Chen CH, Xiao T, Liu JS, Brown M, Liu XS. Quality control, modeling, and visualization of CRISPR screens with MAGeCK-VISPR. Genome biology. 2015 Dec;16(1):281.
Frequently Asked Questions (FAQs)
| S.No. | Questions | Answers |
|---|---|---|
| 1. | What is Polly? | Polly is a one-stop data analysis platform designed to accelerate the drug discovery process. Polly hosts multiple applications that can be combined and/or customized by you to create their own specific analytical workflows. |
| 2. | What is the CRISPR Screening app? | CRISPR Screening is an app built to analyze of CRISPR screening experiments. |
| 3. | What are the input files required to run an experiment in CRISPR Screening app? | Two types of files are required for CRISPR screening analysis; fastq.gz files and sgRNA file. |
| 4. | Can I change the name of my samples? | Yes, the name of any sample can be changed. |
| 5. | How many comparisons can I select in my analysis? | There is no limit to add comparisons in any analysis. |
| 6. | Can I continue my analysis without selecting any parameters? | No, the parameters have to be selected before adding a comparison. |
| 7. | Is the selection of baseline and condition mandatory for any comparison? | Yes, the baseline and condition have to be defined. |
| 8. | What is the base comparison? | A base comparison is the main comparison performed during analysis. This comparison can be further compared with other subsequent comparisons. |
| 9. | What is the cross-analysis comparison? | Cross-analysis comparison is a feature that allows for the comparison between the current and any previous comparisons. It is available in manage comparisons. |
| 10. | How I can access the quality control of my analysis? | After the base comparison or cross-analysis comparison has been selected, the sequence level (sequencing reads, GC content, base quality, mapped reads, Gini index, and zero counts) and sample level (PCA, read count CDF and normalization) quality control can be accessed. |